Search Suggest

Pengujian Pressuremeter (PMT) dan Elastometer D-4719 pada Pondasi Bendungan

Baca Juga:

Pressuremeter test

Pengujian Pressuremeter (PMT) merupakan metode pengujian tanah in-situ yang digunakan untuk menentukan karakteristik mekanik tanah seperti modulus deformasi (E), koefisien Poisson (ν), dan tekanan pra-konsolidasi (σ'c). Pengujian ini dilakukan dengan memasukkan sebuah probe ke dalam tanah dan kemudian mengembangkannya dengan tekanan udara atau cairan. Dengan mengamati perubahan volume dan tekanan, maka parameter-parameter tanah dapat dihitung.

Elastometer D-4719 adalah salah satu jenis alat ukur yang dapat digunakan dalam pengujian PMT. Alat ini berfungsi untuk mengukur deformasi tanah akibat tekanan yang diberikan oleh probe. Data deformasi yang diperoleh kemudian digunakan untuk menghitung modulus deformasi tanah.


Tujuan Pengujian PMT pada Pondasi Bendungan

  • Menentukan Karakteristik Mekanik Tanah: Data PMT sangat penting untuk menentukan karakteristik mekanik tanah pondasi bendungan, yang akan digunakan dalam analisis stabilitas dan perhitungan penurunan tanah.
  • Evaluasi Kualitas Grouting: PMT dapat digunakan untuk mengevaluasi efektivitas grouting pada zona kontak antara pondasi dan tubuh bendungan. Jika grouting berhasil, maka modulus deformasi tanah akan meningkat.
  • Membandingkan dengan Hasil Laboratorium: Hasil PMT dapat dibandingkan dengan hasil uji laboratorium untuk memverifikasi keakuratan parameter tanah yang digunakan dalam analisis.
  • Memantau Perubahan Karakteristik Tanah: PMT dapat dilakukan secara berkala untuk memantau perubahan karakteristik tanah akibat pengaruh beban atau perubahan kondisi lingkungan.

Informasi yang Diperoleh dari Laporan Survey PMT

Laporan survey PMT biasanya berisi informasi berikut:

  • Data Umum: Informasi proyek, lokasi pengujian, tanggal pengujian, dan nama personel yang terlibat.
  • Deskripsi Lapangan: Deskripsi kondisi lapangan saat pengujian, termasuk jenis tanah, kedalaman air tanah, dan aksesibilitas lokasi pengujian.
  • Prosedur Pengujian: Detail prosedur pengujian, termasuk jenis probe yang digunakan, tekanan pengujian, dan frekuensi pengukuran data.
  • Hasil Pengujian: Data mentah hasil pengujian, termasuk kurva tekanan-deformasi, dan hasil perhitungan parameter tanah (E, ν, σ'c).
  • Analisis Data: Analisis data hasil pengujian, termasuk evaluasi kualitas data, perbandingan dengan hasil laboratorium, dan interpretasi terhadap kondisi tanah.
  • Kesimpulan dan Rekomendasi: Kesimpulan mengenai karakteristik mekanik tanah berdasarkan hasil pengujian, serta rekomendasi untuk desain dan analisis struktur.

Pentingnya Data PMT dalam Analisis Stabilitas Bendungan

Data PMT sangat penting dalam analisis stabilitas bendungan karena:

  • Perhitungan Tegangan dan Deformasi: Data PMT digunakan untuk menghitung tegangan dan deformasi dalam tanah pondasi akibat beban bendungan.
  • Evaluasi Kestabilan: Hasil perhitungan tegangan dan deformasi digunakan untuk mengevaluasi faktor keamanan terhadap berbagai jenis kegagalan, seperti longsor dan penurunan.
  • Perancangan Sistem Drainase: Data PMT dapat digunakan untuk merancang sistem drainase yang efektif untuk mengurangi tekanan pori dalam tanah dan meningkatkan stabilitas bendungan.

Langkah-Langkah Pengujian PMT

Pengujian Pressuremeter (PMT) merupakan metode yang cukup kompleks, namun secara garis besar langkah-langkahnya adalah sebagai berikut:

  1. Persiapan Lapangan:

    • Pemilihan Lokasi: Tentukan lokasi pengujian yang representatif terhadap kondisi tanah yang akan diuji.
    • Persiapan Lubang Bor: Bor lubang dengan diameter yang sesuai dengan probe PMT.
    • Pemasangan Probe: Masukkan probe PMT ke dalam lubang bor hingga mencapai kedalaman yang diinginkan.
  2. Pengujian:

    • Inflasi Probe: Pompa udara atau cairan ke dalam probe secara bertahap untuk meningkatkan tekanan.
    • Pengukuran Deformasi: Ukur deformasi tanah akibat tekanan yang diberikan. Deformasi ini biasanya diukur menggunakan sensor yang terpasang pada probe.
    • Pengambilan Data: Rekam data tekanan dan deformasi secara kontinu selama proses pengujian.
  3. Analisis Data:

    • Pembuatan Kurva Tekanan-Deformasi: Plotkan data tekanan dan deformasi untuk mendapatkan kurva karakteristik tanah.
    • Penentuan Parameter Tanah: Hitung parameter tanah seperti modulus deformasi (E), koefisien Poisson (ν), dan tekanan pra-konsolidasi (σ'c) berdasarkan kurva tekanan-deformasi.
  4. Interpretasi Hasil:

    • Evaluasi Kualitas Data: Periksa kualitas data untuk memastikan tidak ada kesalahan atau anomali.
    • Bandingkan dengan Data Laboratorium: Bandingkan hasil PMT dengan hasil uji laboratorium untuk memverifikasi keakuratan data.
    • Interpretasi Kondisi Tanah: Analisis parameter tanah yang diperoleh untuk mendapatkan gambaran mengenai kondisi tanah di lapangan.

Jenis-Jenis Probe PMT

Terdapat beberapa jenis probe PMT yang umum digunakan, antara lain:

  • Probe Selinder: Probe berbentuk silinder yang paling umum digunakan. Probe ini menghasilkan data yang relatif akurat untuk tanah dengan kondisi normal.
  • Probe Menerus: Probe yang memiliki panjang yang lebih panjang dibandingkan dengan diameternya. Probe ini cocok untuk mengukur profil modulus deformasi tanah secara vertikal.
  • Probe Khusus: Probe yang dirancang khusus untuk kondisi tanah tertentu, misalnya tanah berpasir atau tanah lempung yang sangat lunak.

Faktor-Faktor yang Mempengaruhi Hasil Pengujian PMT

  • Jenis Tanah: Jenis tanah sangat mempengaruhi perilaku tanah terhadap tekanan. Tanah berpasir akan memberikan respons yang berbeda dengan tanah lempung.
  • Kadar Air: Kadar air dalam tanah akan mempengaruhi kekuatan dan kekakuan tanah.
  • Struktur Tanah: Struktur tanah seperti lapisan tanah, retakan, dan akar tanaman dapat mempengaruhi hasil pengujian.
  • Kedalaman Pengujian: Kedalaman pengujian akan mempengaruhi nilai parameter tanah yang diperoleh.
  • Kecepatan Inflasi: Kecepatan inflasi probe dapat mempengaruhi hasil pengujian, terutama untuk tanah yang sensitif terhadap kecepatan pembebanan.
  • Kalibrasi Alat: Keakuratan alat ukur sangat penting untuk mendapatkan hasil pengujian yang akurat.

Analisis Numerik Menggunakan Data PMT

Data PMT dapat digunakan sebagai input dalam analisis numerik, seperti analisis elemen hingga (finite element analysis). Dengan mengintegrasikan data PMT ke dalam model numerik, kita dapat:

  • Memprediksi Perilaku Tanah: Memprediksi deformasi dan tegangan dalam tanah akibat beban yang bekerja.
  • Mengevaluasi Stabilitas Struktur: Mengevaluasi stabilitas struktur seperti bendungan, tanggul, dan fondasi.
  • Mendesain Sistem Drainase: Mendesain sistem drainase yang efektif untuk mengurangi tekanan pori dalam tanah.

Penerapan PMT dalam Berbagai Jenis Struktur

Pengujian PMT memiliki banyak aplikasi dalam berbagai bidang teknik sipil, antara lain:

  • Bendungan: Untuk mengevaluasi kondisi tanah pondasi dan memantau perubahan karakteristik tanah selama masa operasi.
  • Jalan Raya: Untuk merancang perkerasan jalan dan mengevaluasi stabilitas lereng.
  • Bangunan Tinggi: Untuk mengevaluasi kapasitas dukung tanah dan memantau penurunan tanah akibat beban bangunan.
  • Terowongan: Untuk mengevaluasi kondisi tanah di sekitar terowongan dan memantau deformasi terowongan.
  • Sampah: Untuk mengevaluasi karakteristik mekanik tanah penimbunan sampah.

Saran untuk melaksanakan pengujian PMT agar mendapatkan data yang akurat:

Persiapan Sebelum Pengujian

  • Pilih Lokasi yang Tepat: Lokasi pengujian harus representatif terhadap kondisi tanah yang ingin diuji. Hindari area yang terganggu oleh aktivitas konstruksi atau getaran.
  • Persiapan Peralatan: Pastikan semua peralatan pengujian dalam kondisi baik dan terkalibrasi. Ini termasuk probe PMT, alat pengukur tekanan, dan alat perekam data.
  • Pelajari Prosedur: Pahami secara detail prosedur pengujian yang akan dilakukan. Ini akan membantu menghindari kesalahan saat pelaksanaan.
  • Dokumentasi: Persiapkan formulir data pengujian untuk mencatat semua data yang diperoleh selama pengujian.

Pelaksanaan Pengujian

  • Kedalaman Pengujian: Tentukan kedalaman pengujian yang sesuai dengan tujuan pengujian. Biasanya, beberapa kedalaman dilakukan untuk mendapatkan profil karakteristik tanah.
  • Kecepatan Inflasi: Atur kecepatan inflasi probe sesuai dengan jenis tanah dan tujuan pengujian. Kecepatan yang terlalu cepat dapat menyebabkan hasil yang tidak akurat, terutama untuk tanah yang sensitif terhadap kecepatan pembebanan.
  • Pengukuran Deformasi: Pastikan sensor deformasi terpasang dengan benar dan tidak terganggu selama pengujian.
  • Pengambilan Data: Rekam data tekanan dan deformasi secara kontinu dan akurat.
  • Ulangi Pengujian: Lakukan pengujian ulang pada beberapa titik untuk memastikan hasil yang diperoleh konsisten.

Analisis Data

  • Pemilihan Metode Analisis: Pilih metode analisis yang sesuai dengan jenis data yang diperoleh dan tujuan pengujian.
  • Evaluasi Kualitas Data: Periksa kualitas data untuk memastikan tidak ada data yang anomali atau error.
  • Bandingkan dengan Data Laboratorium: Bandingkan hasil PMT dengan hasil uji laboratorium untuk memverifikasi keakuratan data.
  • Interpretasi Hasil: Interpretasikan hasil analisis dengan hati-hati. Pertimbangkan faktor-faktor yang dapat mempengaruhi hasil pengujian, seperti jenis tanah, kadar air, dan struktur tanah.

Faktor Tambahan yang Perlu Diperhatikan

  • Pengaruh Lingkungan: Faktor lingkungan seperti suhu dan kelembaban dapat mempengaruhi hasil pengujian.
  • Pengaruh Waktu: Waktu pelaksanaan pengujian dapat mempengaruhi hasil, terutama untuk tanah yang bersifat time-dependent.
  • Keterampilan Operator: Keterampilan operator dalam melakukan pengujian sangat penting untuk mendapatkan hasil yang akurat.

Saran Tambahan

  • Konsultasi dengan Ahli: Konsultasikan dengan ahli geoteknik untuk mendapatkan saran yang lebih spesifik mengenai pelaksanaan pengujian PMT.
  • Dokumentasi yang Lengkap: Dokumentasikan semua aspek pengujian, mulai dari persiapan hingga analisis data. Dokumentasi yang lengkap akan sangat berguna untuk evaluasi di kemudian hari.
  • Kalibrasi Berkala: Lakukan kalibrasi alat secara berkala untuk memastikan keakuratan pengukuran.

Dengan mengikuti saran-saran di atas, diharapkan Anda dapat memperoleh data PMT yang berkualitas dan akurat, yang selanjutnya dapat digunakan untuk analisis dan perancangan struktur yang lebih baik.

Kesimpulan

Pengujian PMT merupakan alat yang sangat berguna dalam bidang geoteknik. Dengan memahami prinsip kerja dan penerapannya, kita dapat memperoleh informasi yang akurat mengenai kondisi tanah dan menggunakannya untuk perencanaan dan desain struktur yang aman dan ekonomis.

Pengujian PMT merupakan alat yang sangat berguna dalam evaluasi kondisi tanah pondasi bendungan. Data yang diperoleh dari pengujian ini sangat penting untuk memastikan keamanan dan keberlanjutan operasi bendungan.

Interpretation of Pressuremeter Test Results

After correcting for pressure and volume losses using their membrane resistance in air and probe in thick-walled steel pipe system calibrations, the engineer plots the corrected pressure test results as applied pressure versus radial strain. The resulting plot shows up to five distinctive portions which characterize the stress-strain behavior of the soil, namely:

  1. The borehole contact pressure or horizontal pressure at rest, ρ0H,
  2. The linear pseudo-elastic stress-strain portion of the deformation curve, defining the initial pressuremeter deformation modulus, E0;
  3. The departure from linear elastic conditions to plastic deformation starting at the yield pressure, ργ;
  4. The unload-reload portions of the test (usually three cycles are performed); and
  5. The development of soil failure, which is represented by limit pressure, ρL, which equals the pressure when the pressuremeter has doubled in size from its contact with the borehole sidewalls. The net limit pressure ρ*L, which equals the limit pressure minus horizontal pressure at rest.

Based on these test features the engineer determines or estimates the following soil parameters:

Contact Pressure ρ0H:

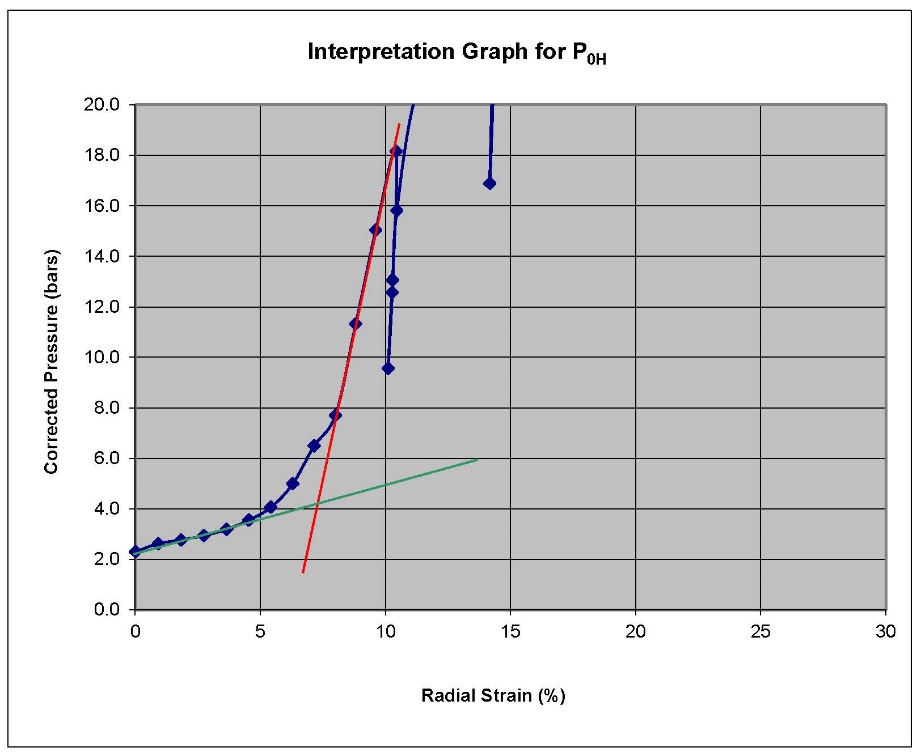
  1. When using the prebored TEXAM unit, the engineer computes the initial contact pressure as the pressure at the intersection of the two lines representing the pseudo elastic (red) and the initial expansion (green) portions of the pressure versus radial strain, as shown on Figure 11. Furthermore, that point represents the radial strain at contact.
Interpretating P0H

Figure 11: Interpretating Ρ0H

Pressuremeter modulus EPMT or Eo:

The engineer computes the pressuremeter modulus by multiplying the slope of the pressure versus radial strain curve along its linear portion by (1 + poisson’s ratio), as follows:

Εwhere the sub-indices 1 and 2 indicate the beginning and the end of the linear portion of the curve, respectively.  For a self-boring pressuremeter test, the linear portion of the stress-strain response occurs between the first data point (zero volume increase) and the subsequent two or three data points.  The engineer assumes a value of the Poisson’s ratio, typically ν = 0.33 for most soils for the above formula.

Because the Pressuremeter modulus ΕPMT corresponds to large strains, namely for radial strains in the 2 to 5 % range, it represents a relatively low value of the elastic modulus.   In practice, the Young’s modulus E can be inferred from Pressuremeter testing using the Menard α factor:

Ε = ΕΡΜΤ/α

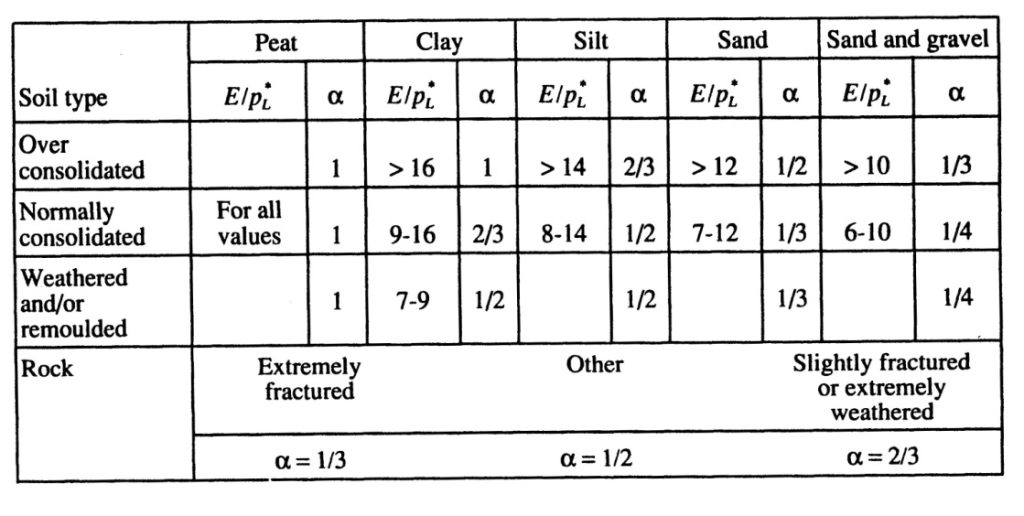
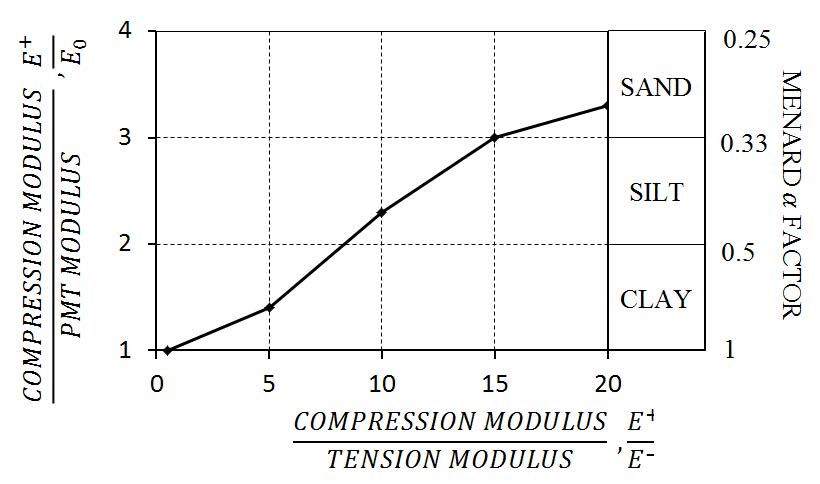
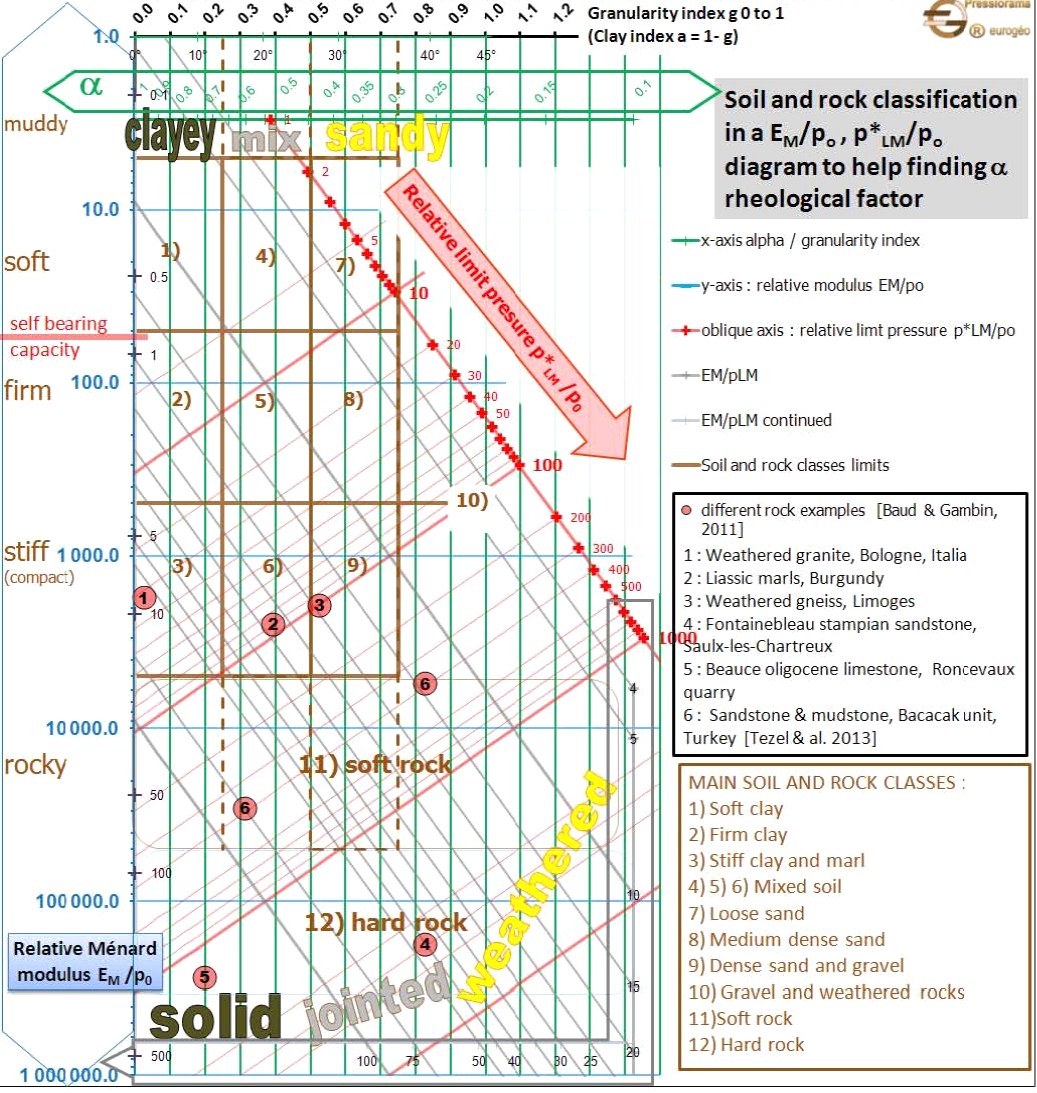
The engineer can choose the Menard α factor from Table 1 or Figure 12:

Typical Menard a factors (from ‘The Pressuremeter’, J.L. Briaud. Balkema, 1992)

Table 1: Typical Menard α factors (from ‘The Pressuremeter’, J.L. Briaud. Balkema, 1992)

Typical Menard a factors

Figure 12: Typical Menard α factors

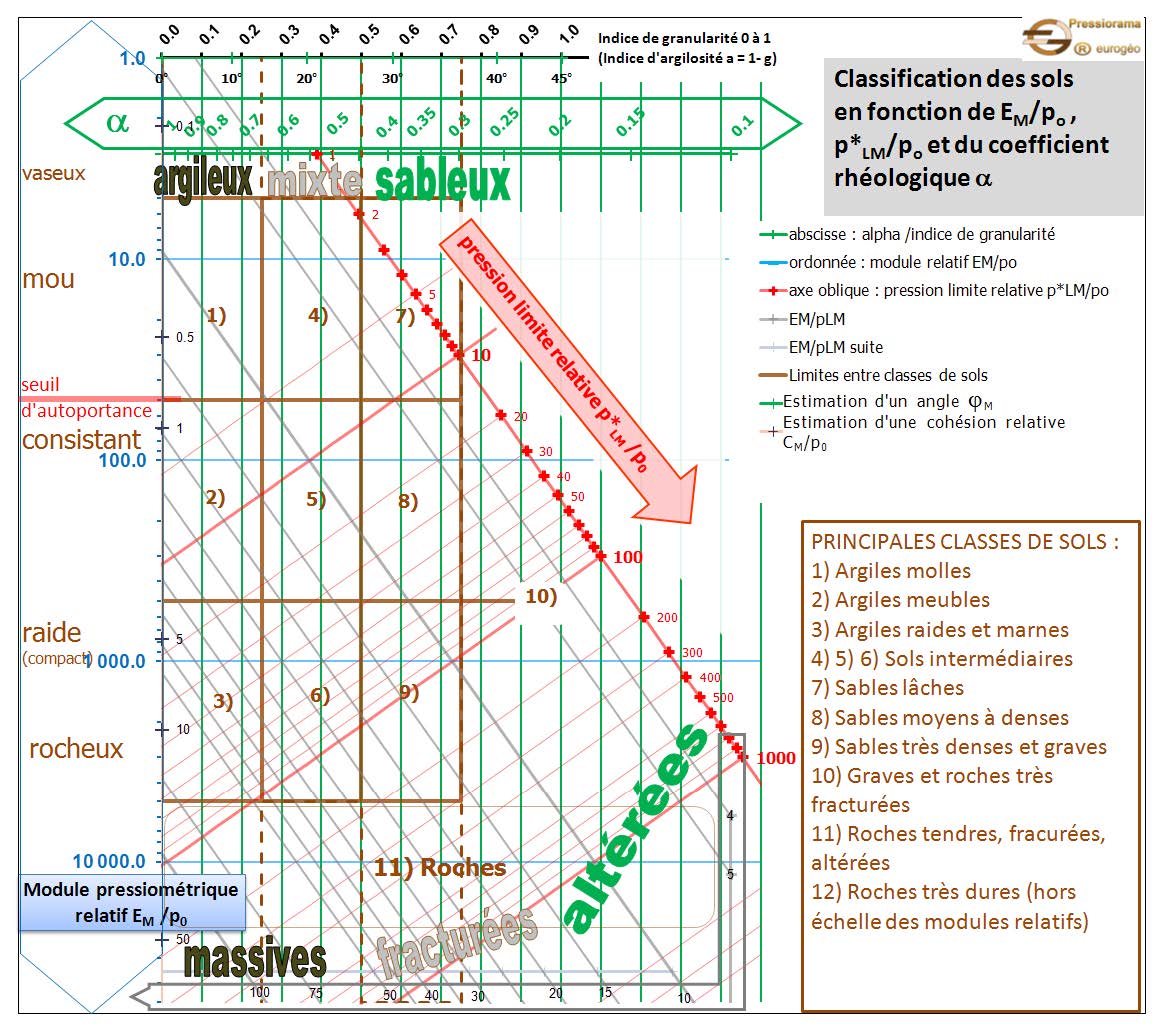
Alternatively, through many years of extensive research, Baud and Gambin 2013 [Français] [English] proposed better-defined values of the Menard α parameter from the Pressiorama chart (Figure 13a [Français] and 13b [English]).

Proposed Menard  factors from Baud J.P., and Gambin M. 2013.

Figure 13a [Français]: Proposed Menard α factors from Baud J.P., and Gambin M. 2013. “Détermination du coefficient rhéologique α de Ménard dans le diagramme Pressiorama”. Proceedings of the 18th International Conference on Soil Mechanics and Geotechnical Engineering. Paris, 2013, Parallel Session ISP 6, International Symposium on the Pressuremeter

Figure 13b [English]: Proposed Menard α factors from Baud J.P., and Gambin M. 2013. “Détermination du coefficient rhéologique α de Ménard dans le diagramme Pressiorama”. Proceedings of the 18th International Conference on Soil Mechanics and Geotechnical Engineering. Paris, 2013, Parallel Session ISP 6, International Symposium on the Pressuremeter.

  1. Yield Pressure  ργ:

The yield pressure signifies the end of the linear pseudo-elastic deformations and the onset of plasticity.  The engineer uses the yield pressure to indicate that pressures exceeding it may have significant creep deformations.  Design bearing pressures for shallow foundations should not exceed the yield pressure.

  1. Unload-Reload Moduli ER and EU:

The engineer calculates the reload and unload moduli by multiplying their respective slopes of the unload-reload loop by (1 + Poisson’s ratio).  He/she uses these values to determine elastic soil deformations upon unloading conditions such as those typically encountered during excavations.  With multiple unload/reload loops, the engineer may model strain hardening of the soil.

  1. Limit Pressure pL /Net Limit Pressure p*L:

The limit pressure, PL, equals the pressure when the soil cavity has expanded to twice its original volume.  The net limit pressure, PL*, equals the limit pressure minus the initial contact pressure poH. The net limit pressure measures the strength of the soil (either under undrained conditions for cohesive soil, or drained conditions for cohesionless soil).  The engineer can compute the radial strain for the limit pressure using the following equation:

Radial Strain at PL = 0.41 +1.41 * Radial Strain at P0H

The engineer should continue to inflate the pressuremeter until he/she has clearly failed the soil and the pressure becomes asymptotic to the limit pressure with increased radial strain.  He/she can extrapolate the corrected pressuremeter test to the calculated radial strain for the limit pressure either by eyeballing the curve or using a second, third or fourth order polynomial curve fit.  We prefer the eyeballing method as it seems to include engineering judgment.

As a second method, the engineer can plot pressure versus 1/V for the plastic phase of the deformations and extrapolate out to the limit pressure.  This second method, also named the “upside down curve” method, is described in “The Pressuremeter and Foundation Engineering” textbook, by F. Baguelin, J. F. Jezequel, and D. H. Shields, published in 1978 by Trans Tech Publications, Section: Methods of extrapolating pressuremeter curves to ρL..  See also ASTM D4719-00, Section 10.6.

  1. Creep Factor, n

By holding the pressure constant by adding volume over time (typically 10 minutes), the engineer computes the creep factor, n, as the slope of the line from the plot of log10(net volume more than the initial volume) [y-axis] versus log10(elapsed time) [x-axis].  When performing settlement analyses, the engineer should either reduce the modulus or increase the total predicted settlement using the below formulas:

E0(design life time in minutes) = E0(time=1 min) * (design life time in minutes/1 minute)-n

Settlement(design life time in minutes)= Settlement(time = 1 minute) * (design life time in minutes/1 minute)n

  1. Some Additional Parameters
In addition, the engineer may use the ratio, (EPMT / p*L) and the creep exponent, n, as a general guideline for soil identification, as follows: 

for sands

7 < EPMT / ρ*L < 12

0.005 < n < 0.03

for clays

12 < EPMT / ρ*L

0.03 < n < 0.08

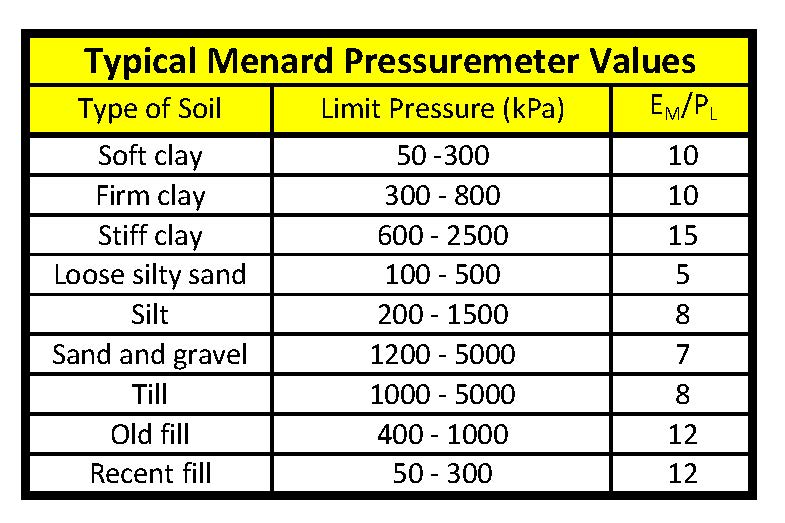
Also, the Canadian Foundation Engineering Manual (4th Edition, 2006) suggests the following ranges for pressuremeter parameters (Table 2).

For most soil types the ratio between the limit and the yield pressures may be expressed as:

1.3 < (ρ*L / ρy) < 2.0

Typical Menard Pressuremeter Values (Canada)

Table 2: Typical Menard Pressuremeter Values (Canada)

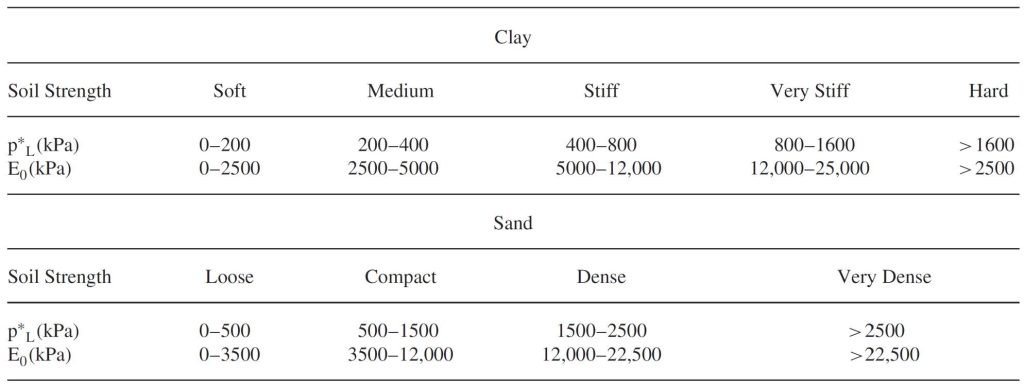
Also as a general guideline, Briaud suggests clays and sands may have the following parameters: (Table 3)

Typical Net Limit Pressures and Moduli Value for Clays and Sands

Table 3: Typical Net Limit Pressures and Moduli Value for Clays and Sands

Judging the Quality of the Pressuremeter Test:

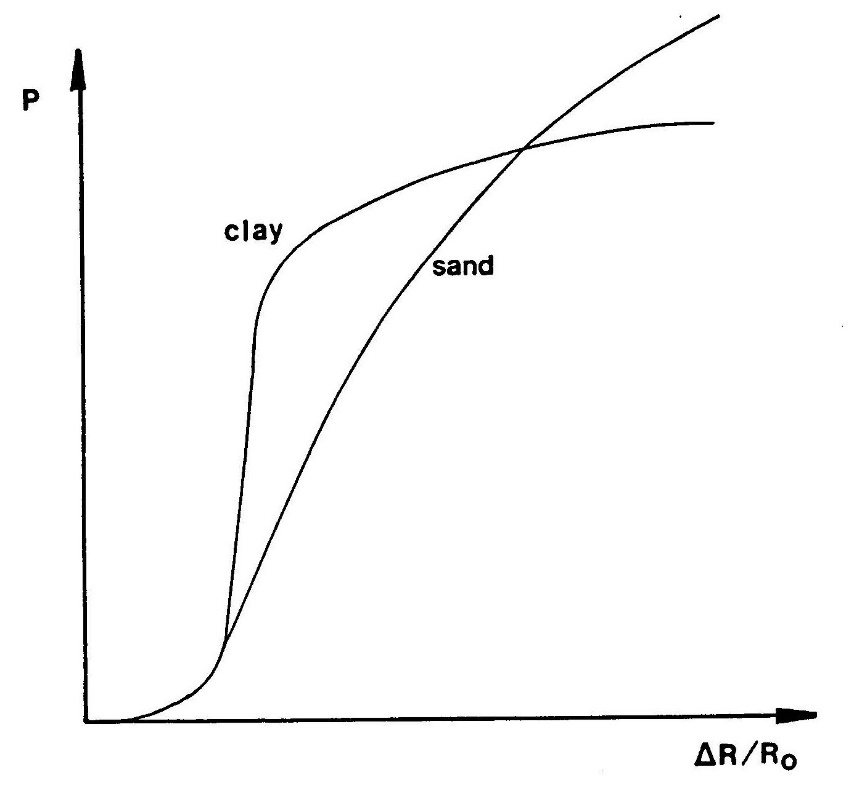
Figure 14 (Briaud 1988 FHWA Manual) shows example of good quality pressuremeter tests for sands and clays. Clays clearly fail with increased radial strain, while sands fail more gradually.


Figure 14: Examples of high quality pressuremeter tests for clay and sand

Examples of high quality pressuremeter tests for clay and sand

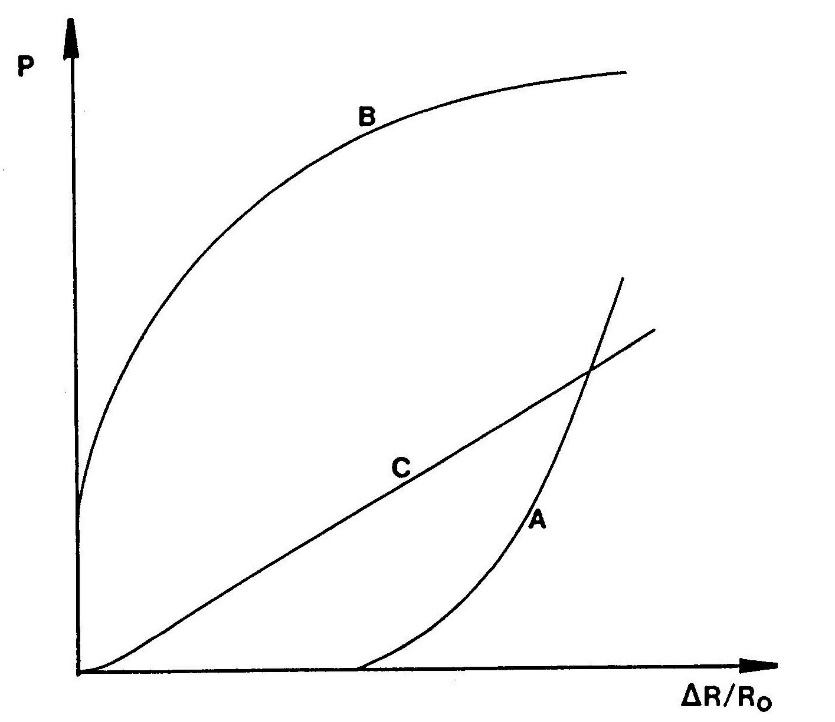
Figure 15 (Briaud 1988 FHWA Manual) shows example of poor quality pressuremeter tests caused by poor borehole preparation. For Case “A” the borehole is too large and the modulus may be interpreted but the limit pressure cannot be interpreted. For Case “B” the borehole is too small and the modulus may not be interpreted due to soil disturbance but the limit pressure may be interpreted. For Case “C” the soil has been disturbed during drilling and neither the modulus or limit pressure can be interpreted. The engineer and driller should make adjustment to the drilling procedure so that high quality test holes, like those in Figure 14, are made eliminating interpretation uncertainty from poor quality boreholes.


Figure 15: Poor quality tests from poorly made boreholes

Poor quality tests from poorly made boreholes

Shear Strength Parameters

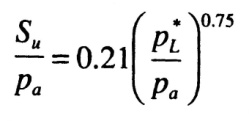
The engineer may predict the undrained shear strength of cohesive soils from the following equation:

where ρα represents a reference pressure (i.e., atmospheric pressure = 100 kPa), after J.L. Briaud (‘The Pressuremeter’, Balkema, 1992).

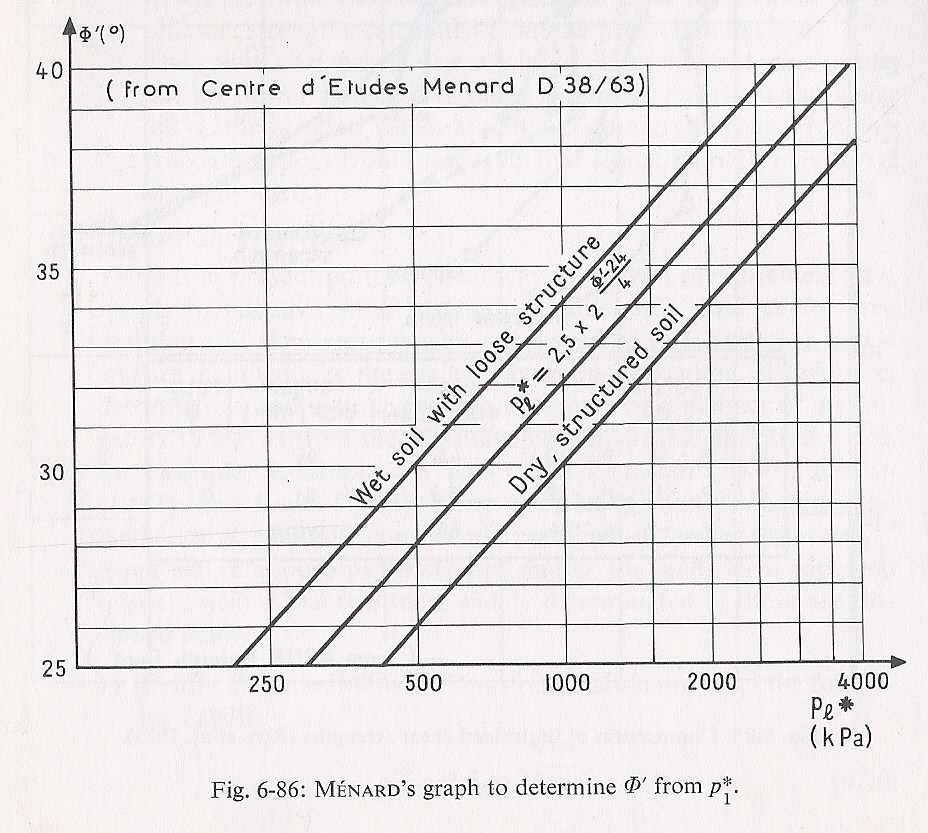
The drained friction angle of cohesionless soils (c’ = 0) may be estimated using the empirical correlations illustrated in the graph shown on Figure 16.  This approach is outlined by Baguelin et.al., in “The Pressuremeter and Foundation Engineering” (F. Baguelin; J.F. Jézéquel; and D.H. Shields. TransTech Publications. 1978), and it requires some knowledge on the state or conditions of the cohesionless material.  This approach only provides a likely range of friction angles from interpreted limit pressure values.

Figure 16: Estimating angle of internal friction from net limit pressure 

Estimating angle of internal friction from net limit pressure

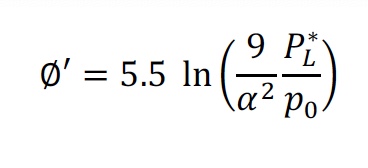
Baud and Gambin [Français] [English] present a modified Pressiorama chart as Figures 17a [Français] and 17b [English] that correlates the angle of internal friction from pressuremeter test data as isobars on those charts. The equation for computing the angle of internal friction is presented below:

Modified Pressiorama Chart to compute angle of internal friction [Français]

Figure 17a: Modified Pressiorama Chart to compute angle of internal friction [Français]

Modified Pressiorama Chart to compute angle of internal friction [English]

Figure 17b: Modified Pressiorama Chart to compute angle of internal friction [English]

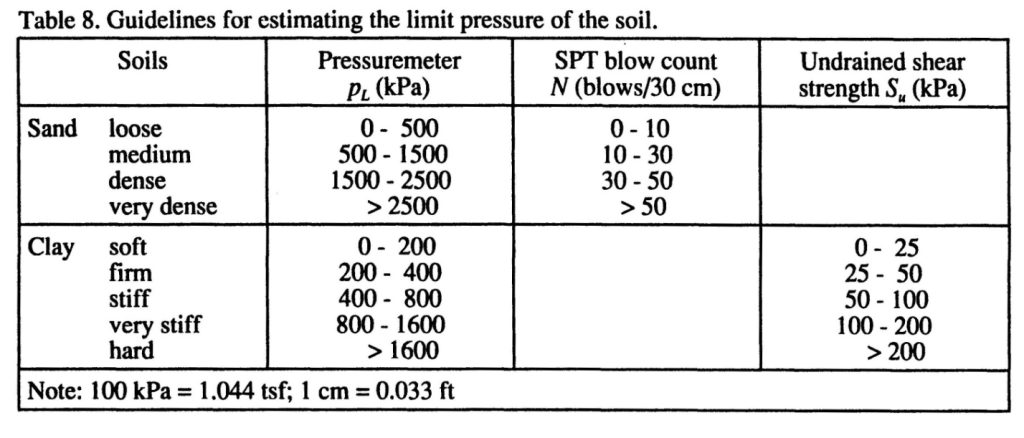
Conservative estimates (lower‐bound estimates) of strength parameters can also be inferred from Table 4:

Estimates for limit pressures

(from ‘The Pressuremeter’, J.L. Briaud. Balkema, 1992)

Table 4: Estimates for limit pressures

Design of Shallow Foundations:

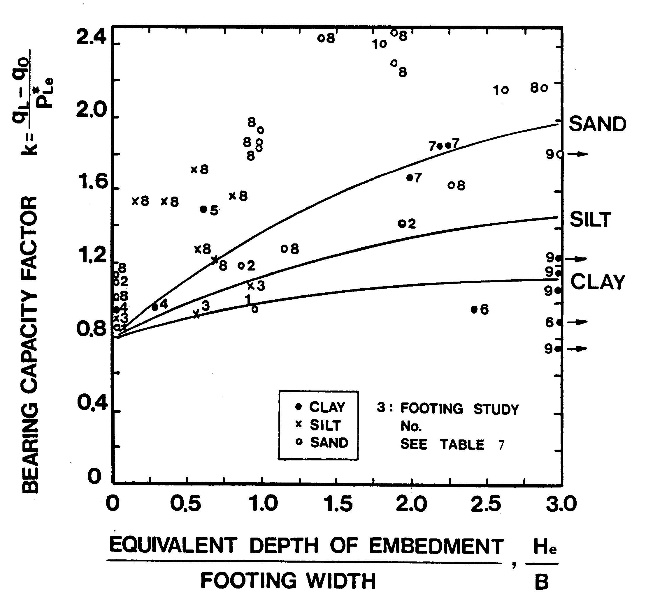
With pressuremeter data, the engineer can design shallow foundations using bearing capacity and settlement criteria. For bearing capacity criteria, he/she designs based on an equivalent net limit pressure within 1.5 times the footing width above and below the footing depth and uses the following equation for the ultimate bearing capacity.

qL = (k)(ρLe*) + q0

where k can be obtained from Figure 18—Briaud (2021) suggests using k =0.9 for clay or k = 1.2 for sand

pLe* = equivalent net limit pressure, and

q0 = total stress overburden pressure at the footing depth.

k factor for bearing capacity
Figure 18: k factor for bearing capacity

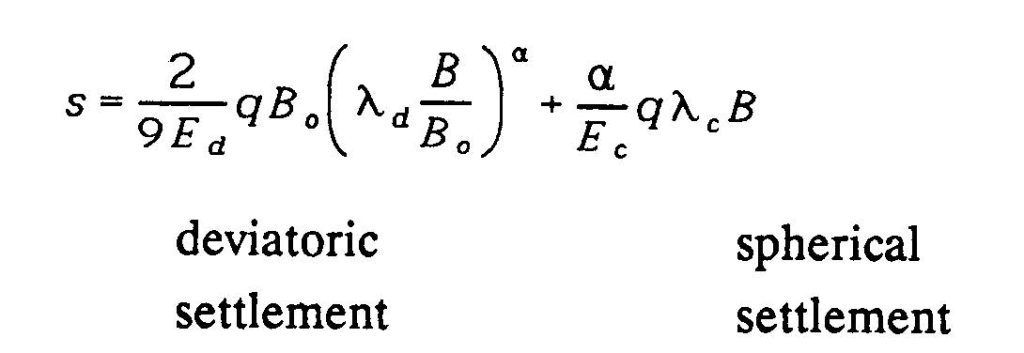
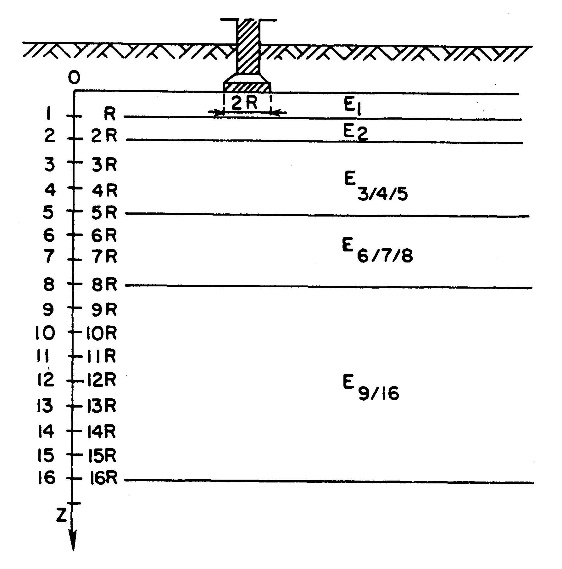
The engineer can compute settlement using either 1) the Menard and Rousseau (1962) method or 2) Briaud (2013) method. For the Menard and Rousseau method, he/she uses the following equation where the first term represents deviatoric settlement and the second term represents spherical settlement.

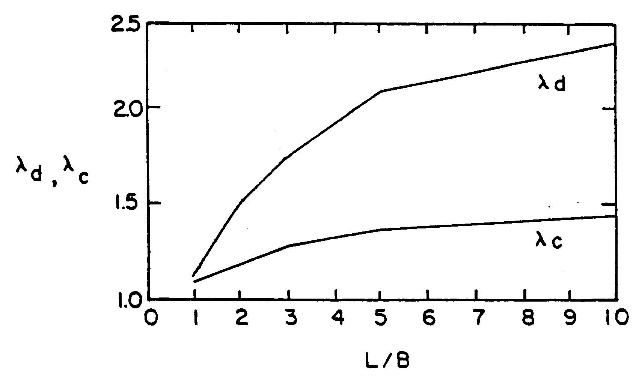
Figure 12 provides recommended values for α factor and λc and λd represent Menard’s shape factors, obtained from Figure 19. The engineer computes Ec as the pressuremeter modulus within B/2 below the footing, while Ed as a geometric mean or average within 8B below the footing as shown on Figure 20 and uses equation:
Menard’s shape factors

Figure 19: Menard’s shape factors

Because the modulus is a denominator term in the settlement computation, he/she must use a geometric mean rather than the mean or average value.

Figure 20: Calculation of Ed

Calculation of Ed

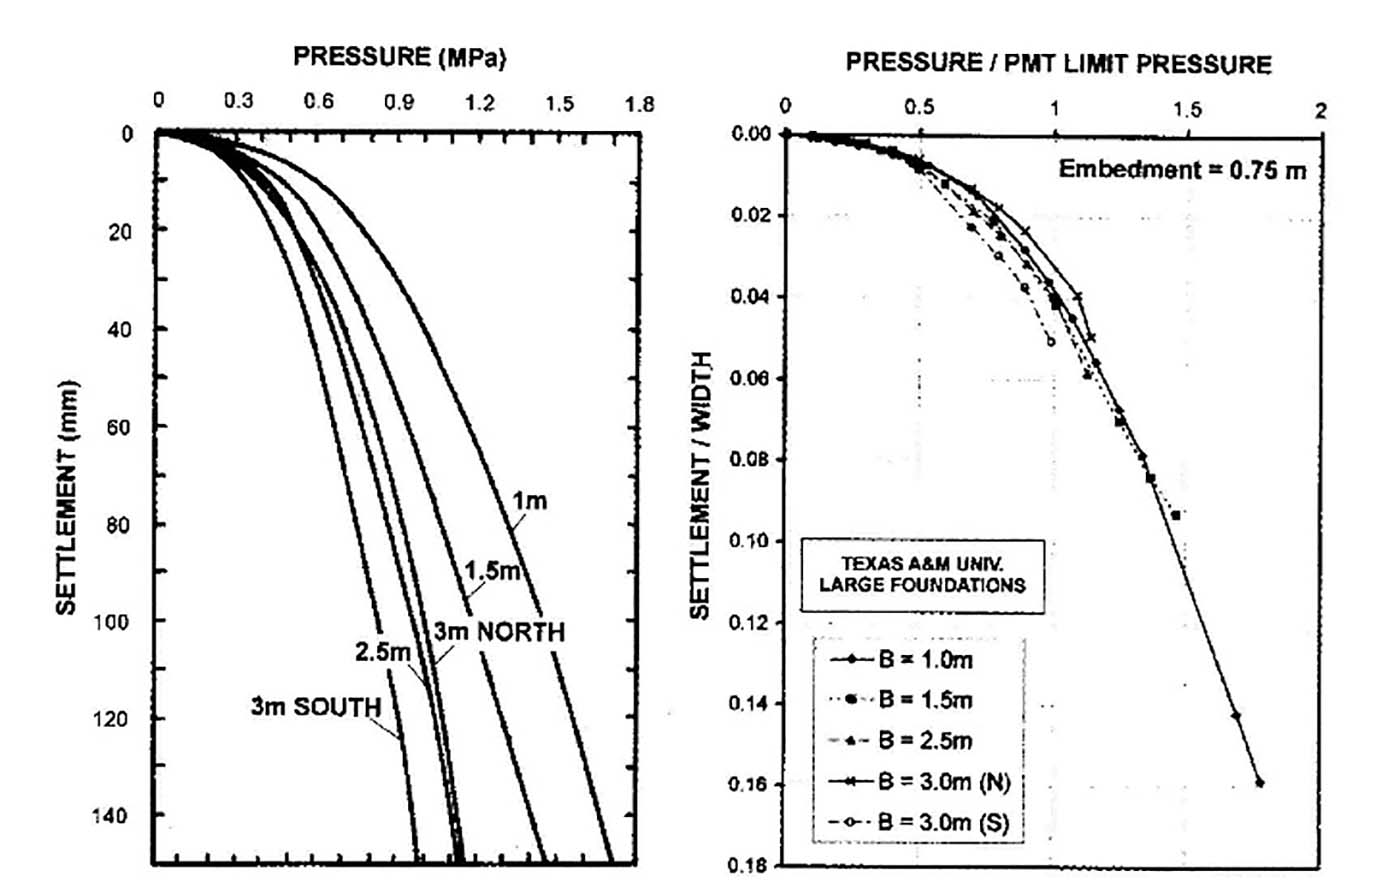
The Briaud method uses the entire pressuremeter test curve to simulate a footing load test with calculations shown on Load Settlement Curve Method Excel spreadsheet. Instead of using empirical α factors to evaluate time dependent settlement, the engineer uses the measured creep factor, n. Figure 21 shows how well Briaud’s method compares with load test results from different width footings.

Briaud method‐‐comparison with footing load tests

Figure 21: Briaud method‐‐comparison with footing load tests

Design of Deep Foundations

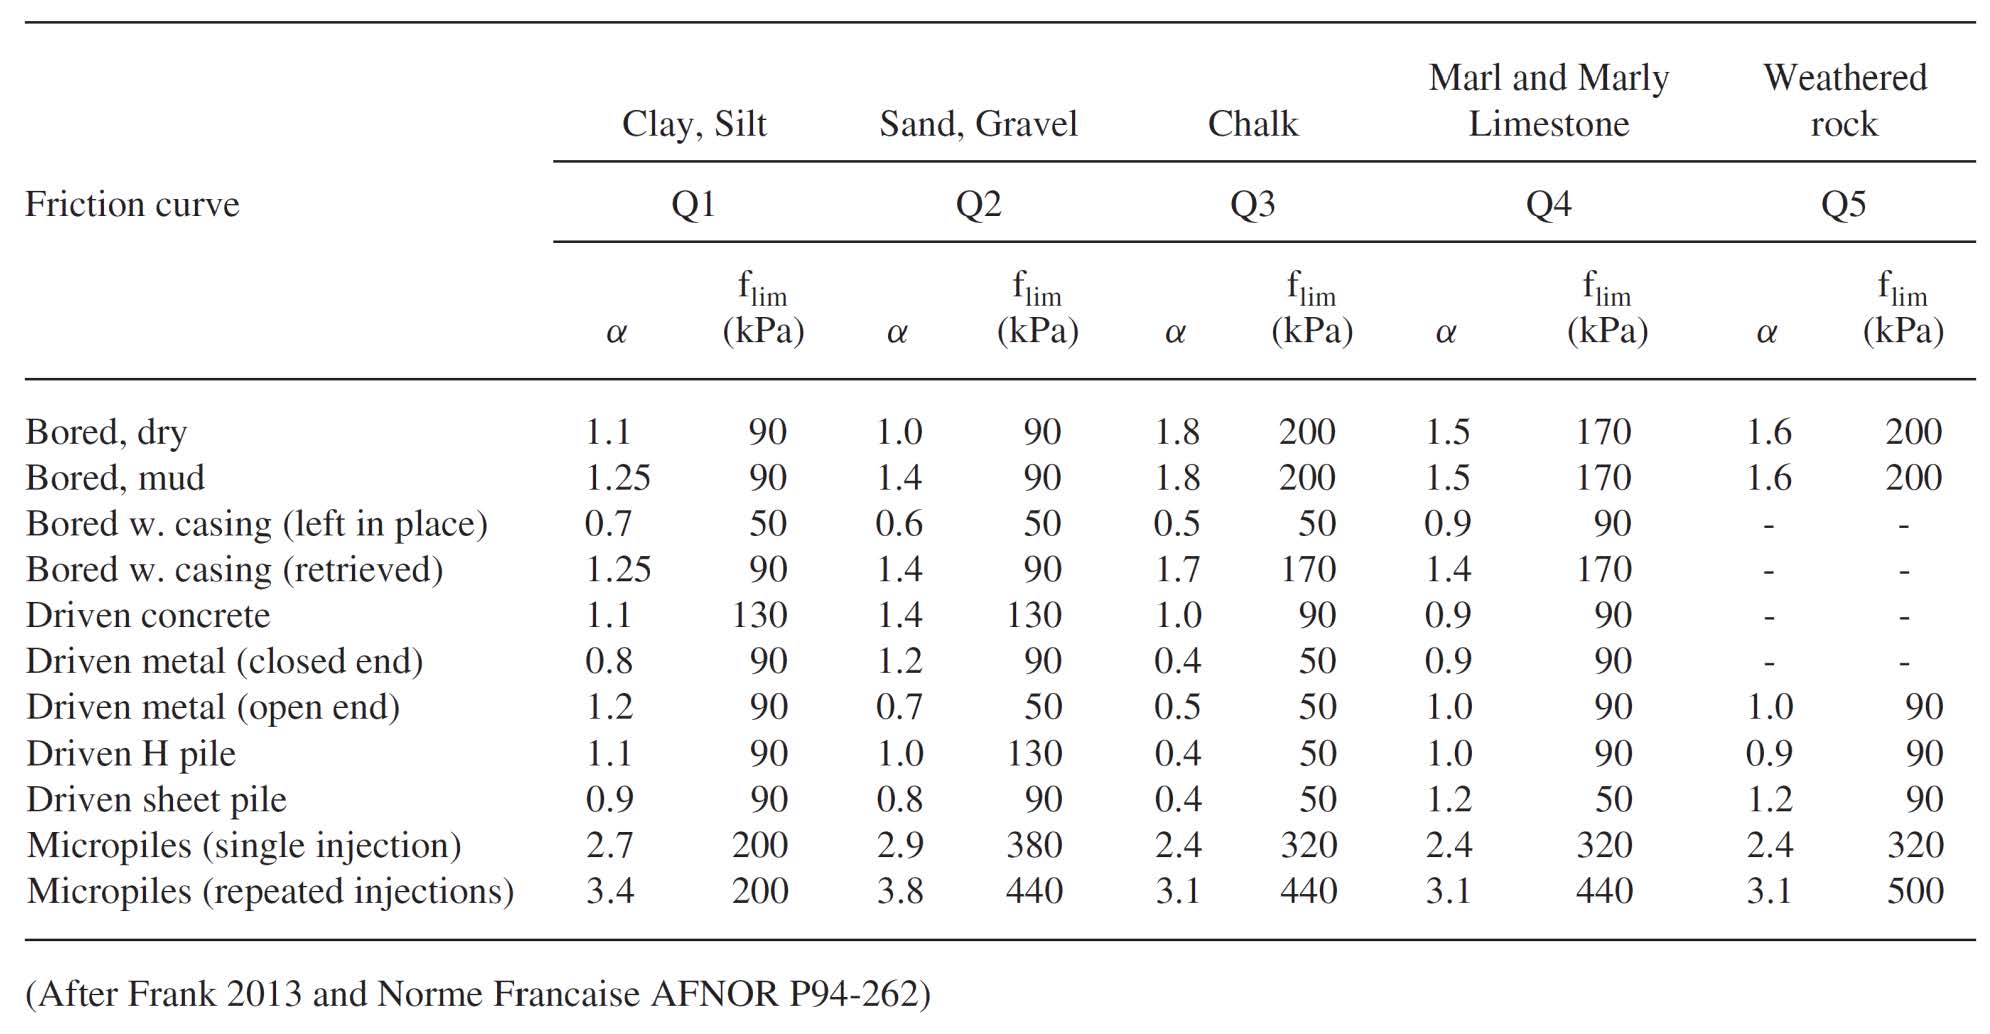
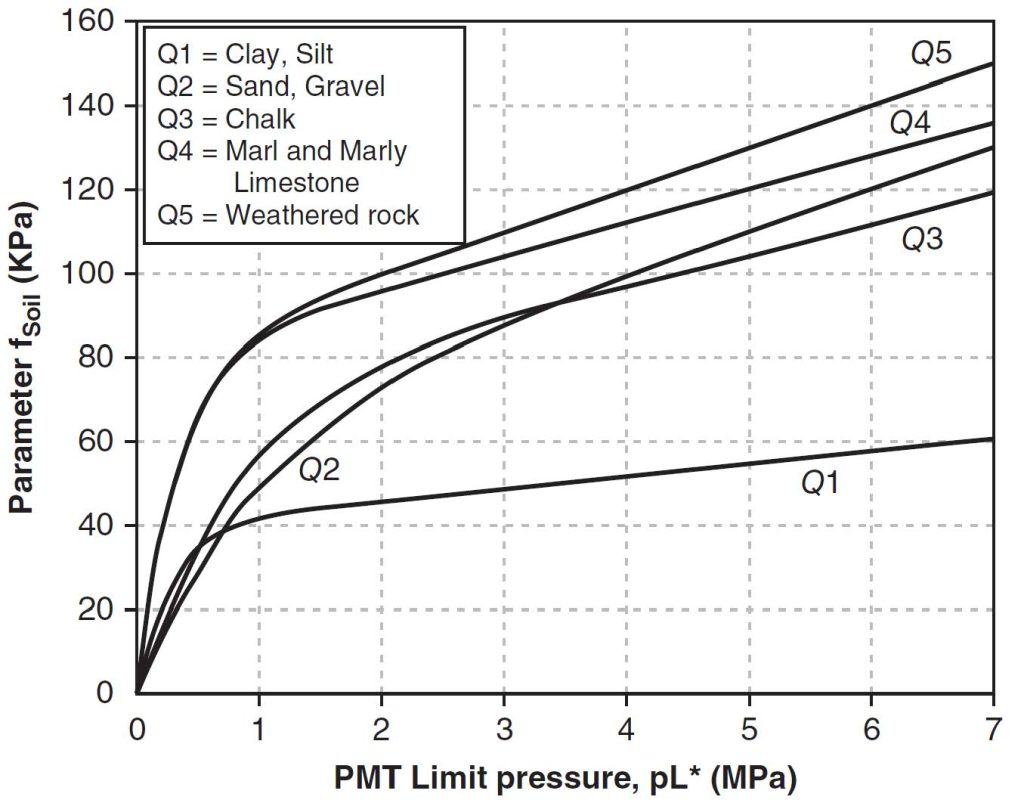
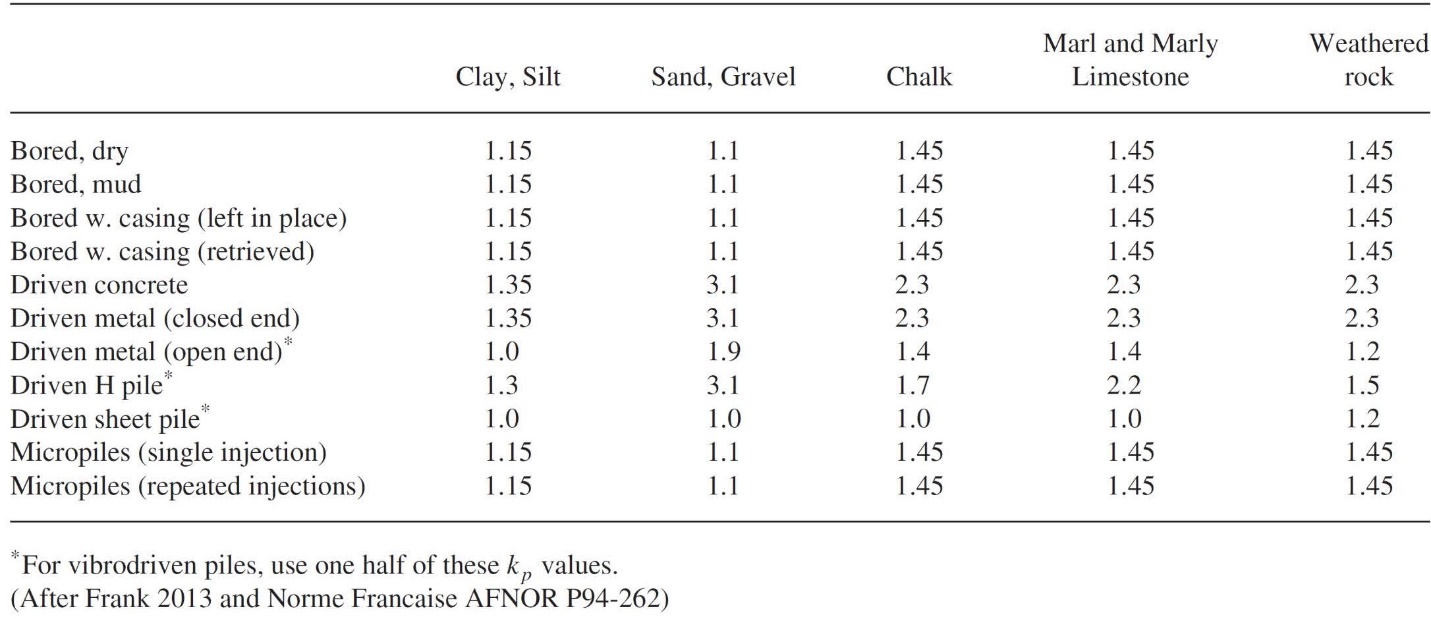
The engineer designs the vertical capacity of a deep foundation based on the pressuremeter limit pressure. He/she computes the frictional capacity using the following equation and obtains the correlation factors from Table 5 and Figure 22 depending on the soil type:

fu = α * fsoil *As

where α = pile type/installation method factor
fsoil = frictional capacity of the soil/rock not exceeding recommended maximum value,
As = side or circumferential area of the deep foundation, and
fu = ultimate side shear resistance of the deep foundation.

Pile installation method and type factors and maximum frictional resistances
Table 5: Pile installation method and type factors and maximum frictional resistances
Soil friction resistances based on limit pressure and soil/rock type

Figure 22: Soil friction resistances based on limit pressure and soil/rock type

The engineer computes the ultimate tip resistance using the following equation:

pu = [kp * pL + γ * d] * Ap

Where kp equals a bearing capacity factor (Table 5),

pL = the average limit pressure 1.5 * pile width/diameter above and below the tip,

γ = average unit weight,

d = pile tip depth,

Ap = tip area, and

pu = ultimate tip capacity.

Table 6: Bearing capacity factors, kp, for deep foundation design

Lateral Load Capacity for Deep Foundations:

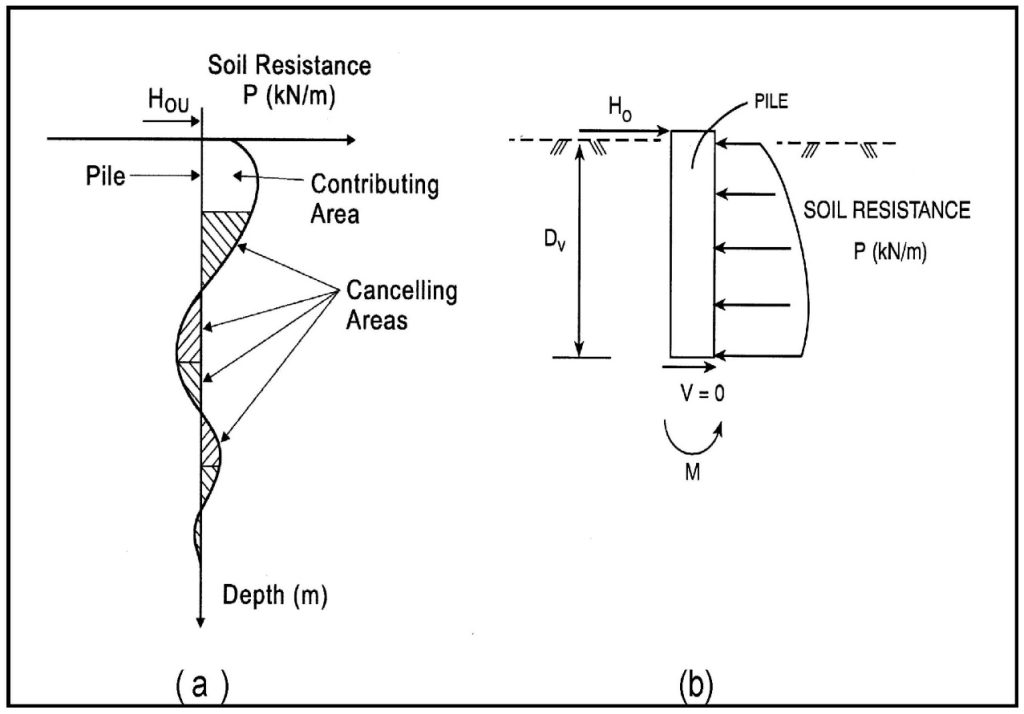
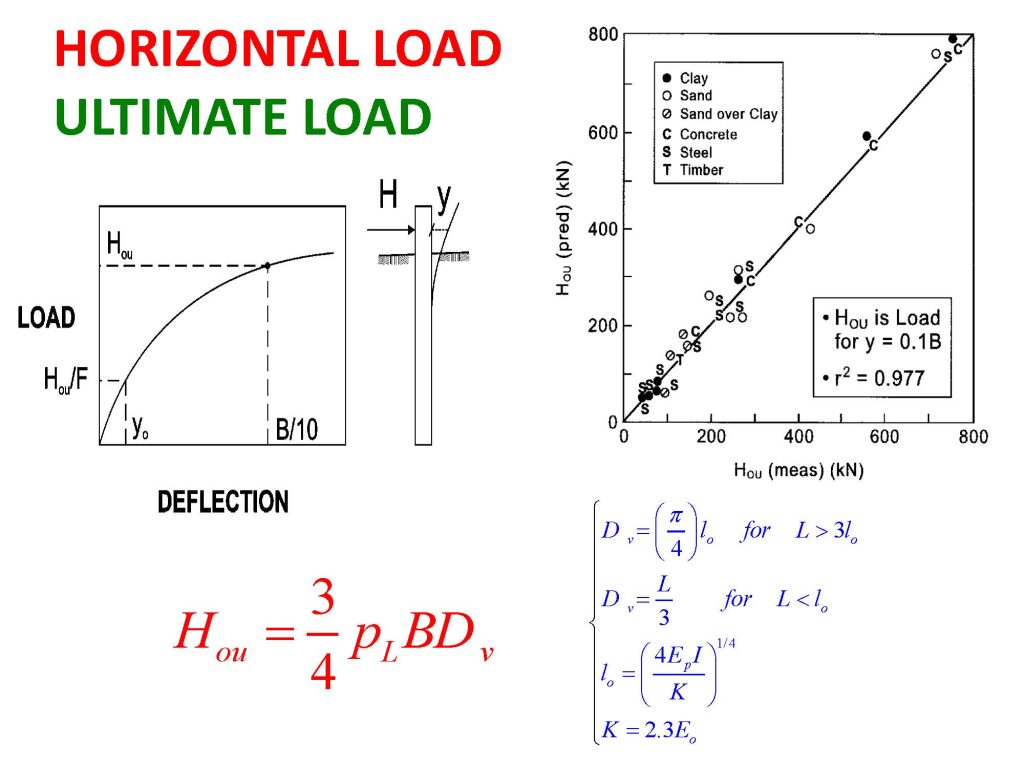
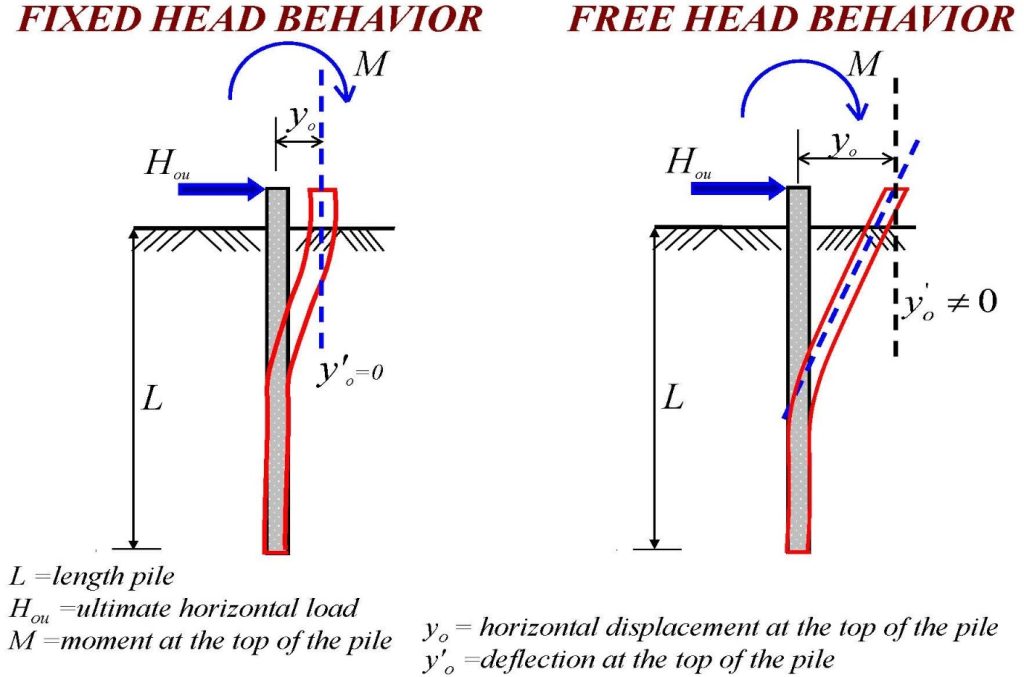
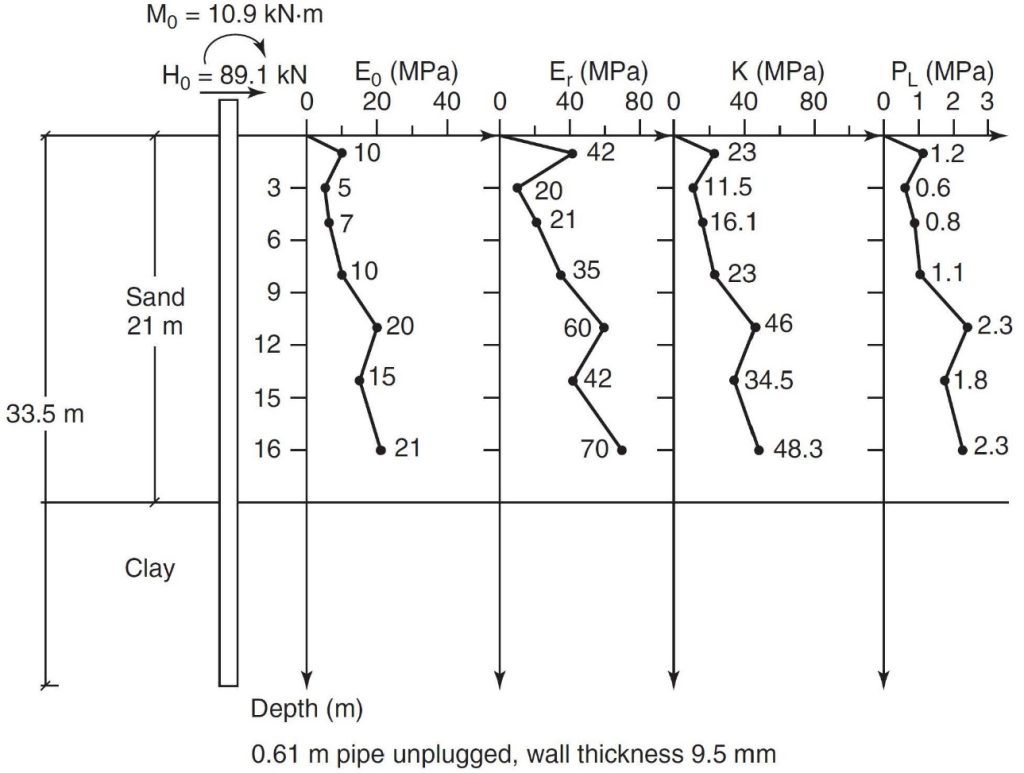
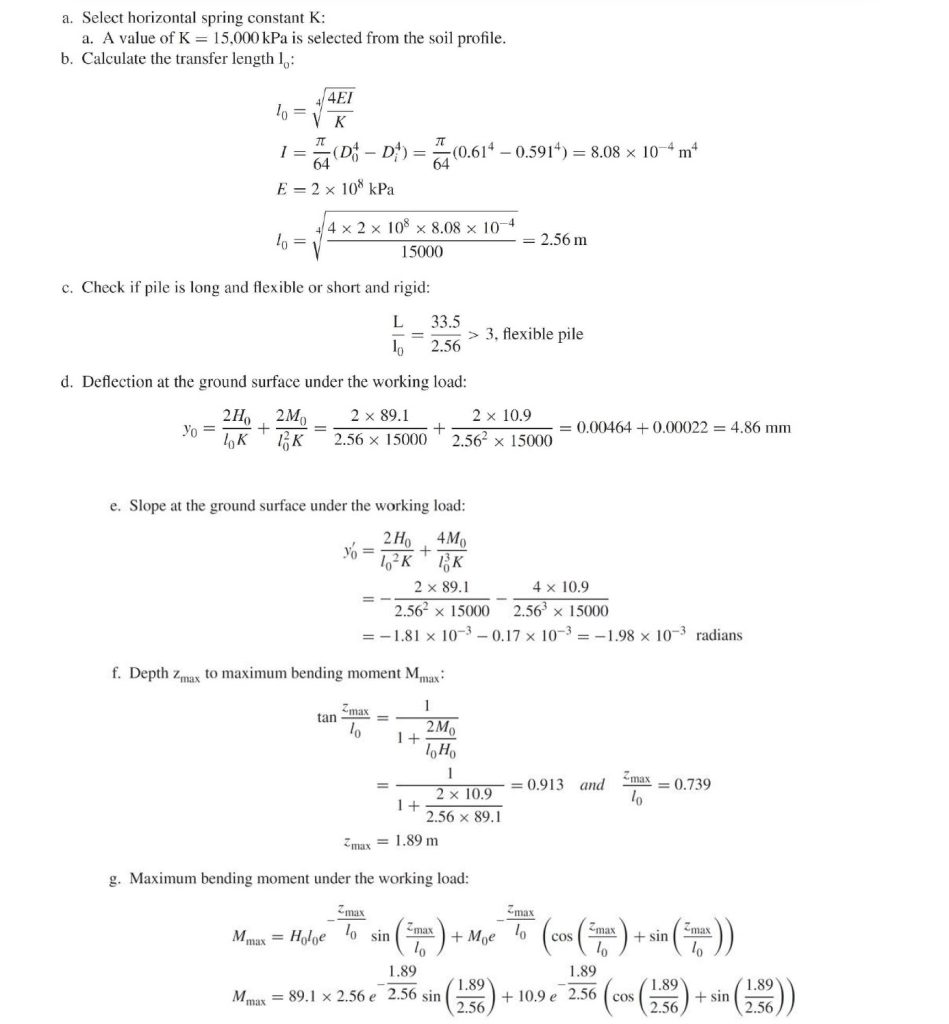
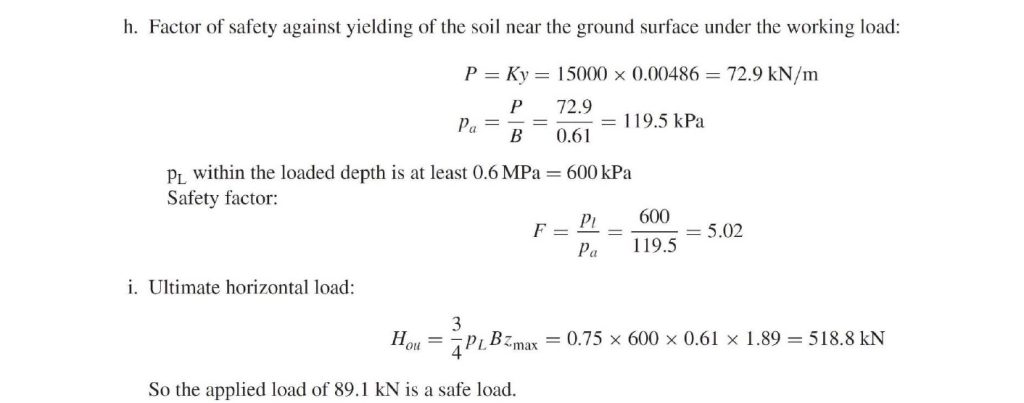
The pressuremeter laterally expands into the soil or rock and ideally models the lateral load capacity of a deep foundation. Briaud (2021) clearly explains the lateral load capacity analyses in Figures 23-28 and presents an example computation of a long flexible pile subjected to lateral loads.

Lateral load resistance concept

Figure 23: Lateral load resistance concept

Computation of ultimate lateral capacity at deflection of B/10

Figure 24: Computation of ultimate lateral capacity at deflection of B/10

Fixed head versus free head behaviors

Figure 25: Fixed head versus free head behaviors

Lateral displacement at ground surface for horizontal plie load
Figure 26: Lateral displacement at ground surface for horizontal plie load
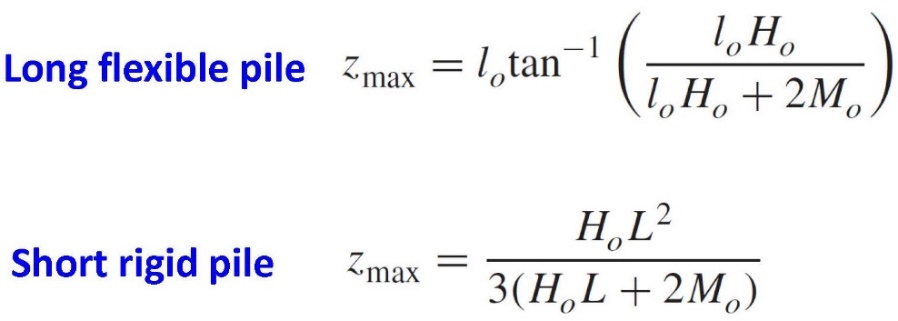
Depth to maximum moment formulas
Figure 27: Depth to maximum moment formulas
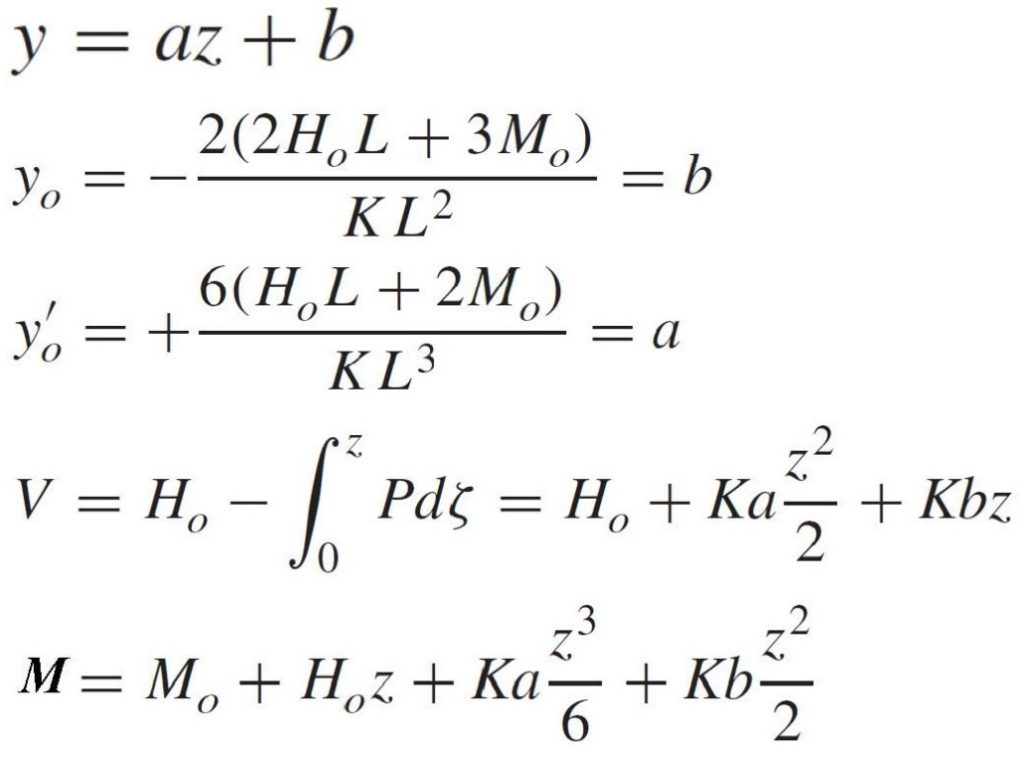
Lateral load formulas for deflection, slope, shear and moment

Figure 28: Lateral load formulas for deflection, slope, shear and moment

Example of lateral load capacity calculations for long flexible pile
Figure 29: Example of lateral load capacity calculations for long flexible pile

Penutup

Sekian Penjelasan Singkat Mengenai Pengujian Pressuremeter (PMT) dan Elastometer D-4719 pada Pondasi Bendungan. Semoga Bisa Menambah Pengetahuan Kita Semua.

Posting Komentar

pengaturan flash sale

gambar flash sale

gambar flash sale